Introducing your old functions to your new friend tidyverse
A while back I wrote some R functions to analyze and summarize data for an ongoing quarterly report project I had been doing. The functions worked fine and I used them for a while, but then when I learned about the tidyverse I realized I could rewrite the functions more efficiently using the purrr, dplyr and tidyr packages.
Unfortunately, just as I was finishing the function makeover project, I discovered I don’t have this freelance job anymore! But I was so close, I decided to finish making over the functions anyway and document the process.
So let’s load some of the tidyverse packages that we’ll need here. I’m also loading the pander package for table formatting, and ggplot2 so I can make some summary charts later.
library(readr)
library(dplyr)
library(tidyr)
library(pander)
library(ggplot2)
Read in the sample data with readr
This data relates to institutional asset management activity. Each record represents an asset manager being hired by an investor. Identifying variables inculde asset manager, date, institution name, institution type, asset class and investment region.
We can use the readr function read_csv() to read in a csv file. USYmanagers.csv is a dataframe of asset manager hiring activity among US institutions (i.e. pension funds, foundations, endowments) for 12 months.
USmanagersY <- read_csv("USmanagersYear.csv") ###Original functions
These were the first R functions I wrote since grad school and they turned out to be kind of a mess. I used many for loops and had a lot of dupicate code among functions.
Many of the tables I produced for these quarterly reports were a summary of asset managers by the number and total dollar value of the mandates they were hired for. After doing an overall summary, I then focused on filtering by asset class, or investment region, or investor location, etc. In my original function-writing process, I ended up writing a different function for each of these cases. Then of course, I ended up with a lot of duplicate code.
####Original manager table function (general) Here is the function I wrote to create a table of asset managers sorted by the number and dollar value of the accounts they were hired to manage. This is the general one that does not filter by any criteria. It’s pretty long.
mgrTableORIGINAL <- function(df1, sortz=1){
  MGR <- levels(droplevels(df1$AssetManager))
  totals <- c("total1", "total2")
  z <- rep(0, length(MGR)*length(totals))
  #create matrix
  m1 <- matrix(z, nrow=length(MGR), ncol=length(totals))
  rownames(m1) <- MGR
  colnames(m1) <- totals
  #fill matrix
  for(i in 1:length(MGR)){
    m1[i,1] <- nrow(df1[df1$AssetManager==MGR[i],])
    m1[i,2] <- sum(df1[df1$AssetManager==MGR[i], "AccountSizeAmount"])
  }
  if(sortz==1){
    m2 <- m1[order(m1[,2],m1[,1],decreasing=TRUE),]
  }else{
    m2 <- m1[order(m1[,1],m1[,2],decreasing=TRUE),]
  }
  return(m2)
}
There’s too much going on in this busy function! Let’s start with the arguments:
df1: the dataframe(USmanagersY in thie case)sortz: determines whether to sort by number of hires or disclosed value of hires(default is disclosed value)
I used the levels() and droplevels() functions on columns a lot in these old functions, which I would save as variables and use a few different ways:
- To get row and column names for my tables,
- To find the number of categories (i.e. the
length()), so I knew the number of rows and columns to make the matrix - To use as a counter in my for loops to populate the matrix
####Original manager table function (filtered by asset class)
After mgrTableORIGINAL() I wrote other functions that were almost exactly like the one above but filtered by some criteria. Apparently it didn’t occur to me to call MgrTableORIGINAL() in other functions so I just rewrote it a bunch of times! This one filters by the column “MainAssetClass”:
mgrTableACORIGINAL <- function(df1, assetclass, sortz=1){
  dftemp <- df1[df1$MainAssetClass==assetclass,]
  MGR <- levels(droplevels(factor(dftemp$AssetManager)))
  totals <- c("total1", "total2")
  z <- rep(0, length(MGR)*length(totals))
  #create matrix
  m1 <- matrix(z, nrow=length(MGR), ncol=length(totals))
  rownames(m1) <- MGR
  colnames(m1) <- totals
  #fill matrix
  for(i in 1:length(MGR)){
    m1[i,1] <- nrow(dftemp[dftemp$AssetManager==MGR[i],])
    m1[i,2] <- sum(dftemp[dftemp$AssetManager==MGR[i], "AccountSizeAmount"])
  }
  if(length(MGR)==1){
    return(m1)
  }
  if(sortz==1){
    m2 <- m1[order(m1[,2],m1[,1],decreasing=TRUE),]
  }else{
    m2 <- m1[order(m1[,1],m1[,2],decreasing=TRUE),]
  }
  return(m2)
}
So this one takes three arguments:
1. df1: the dataframe(USmanagersY in this case)
2. assetclass: a string of the asset class to filter by
3. sortz: determines whether to sort by number of hires or disclosed value of hires(default is disclosed value)
It’s pretty much the same as the general one above, it just filters by an asset class before it creates a table.
And then I had a few other similar functions that filtered by other columns such as “InvestmentRegion” and “SubAssetClass”.
I’m not going to bore you with all of them here because they’re all so similar and they would go on forever! But here is a function call to mgrTableACORIGINAL() to show you it works. Here is an asset manager summary for the asset class “Commodities”:
pandoc.table(mgrTableACORIGINAL(USmanagersY, "Commodities"), style = "rmarkdown")
##
##
## |                                | total1 | total2 |
## |:-----------------------------------:|:------:|:------:|
## |  **NGP Energy Capital Management**  |   2    |  310   |
## |         **Geronimo Energy**         |   1    |  300   |
## |     **Energy Capital Partners**     |   1    |  250   |
## |      **Avenue Capital Group**       |   1    |  150   |
## |     **Quantum Energy Partners**     |   3    |  142   |
## |            **BlackRock**            |   1    |  100   |
## |     **Sprott Asset Management**     |   1    |  100   |
## |    **Bluescape Energy Partners**    |   1    |   90   |
## |     **Edge Natural Resources**      |   1    |   75   |
## |       **Lime Rock Partners**        |   1    |   50   |
## |      **Natural Gas Partners**       |   1    |   50   |
## |   **Five Point Capital Partners**   |   1    |   40   |
## |         **Denham Capital**          |   1    |   30   |
## |     **Energy & Minerals Group**     |   1    |   25   |
## |   **Mountain Capital Management**   |   1    |   25   |
## |         **EnCap Flatrock**          |   1    |   20   |
## |        **Blue Water Energy**        |   1    |   10   |
## | **Kayne Anderson Capital Advisors** |   1    |   10   |
## |    **Carnelian Energy Capital**     |   1    |  7.5   |
## |         **Corex Resources**         |   1    |   0    |
## |        **EnCap Investments**        |   1    |   0    |
###Updating the original asset manager tables
After learning about dplyr and the tidyverse I realized I could use dplyr::summary() in conjunction with other dplyr verbs to make most of the tables I needed, instead of calculating the dimensions to make a matrix and then using for loops to populate it.
####Updated asset manager table (general)
I started with a main asset manager table, which is already so much faster and cleaner than the earlier mgrTableORIGINAL() because it needs zero for loops because I grouped and summarized using dplyr verbs. Take a look:
mgrTableNEW <- function(df1, sortz = 1) {
  mgrz <- df1 %>%
    replace_na(list(AccountSizeAmount = 0)) %>%
    group_by(AssetManager) %>%
    summarise(Total = n(), SumTotal = sum(AccountSizeAmount)) %>%
    replace(., is.na(.), 0)
  if(sortz != 1) {
    mgrz <- arrange(mgrz, desc(Total), desc(SumTotal))
  } else {
    mgrz <- arrange(mgrz, desc(SumTotal), desc(Total))
  }
  return(mgrz)
}
So fresh and so clean! It takes the same two arguments as MgrTableORIGINAL(). Instead of creating a matrix and using a for loop to populate it, it uses the dplyr verbs group_by(), summarise() and arrange(), as well as the tidyr function replace_na() in order to replace NA AccountSizeAmount values with zeroes.
OK, I think that looks pretty easy to understand (espcially compared to the ORIGINALS) so let’s move to the filtered asset manager table functions.
####Updated asset manager table (filtered by any column) At first I wrote down a list of all the functions I had to rewrite and was going to do them one by one, but then I realized I didn’t have to rewrite all of them if I just wrote one super function to replace them all. I would have to make it more generic.
Introducing mgrTableX()! Instead of writing a whole new asset class-specific function, and then a new investment-region specific function, and then a cap size-specific function (and so on, and on…) I could write a function that would let me pass the column name I wanted to filter by, in addition to the filter criteria.
mgrTableX() takes four arguments. (Note that colname is the only addition to the three arugments from MgrTableACORIGINAL()):
df0: the dataframe (USmanagersY in this case)colname: the column we want to filter bysubclass: a string of the criteria to filter the column bysortz: determines whether to sort by number of hires or disclosed value of hires (default is by disclosed value)
The colname and subclass arguments are used with dplyr::filter(). This was my first shot at this function:
mgrTableXv1 <- function(df0, colname, subclass, sortz = 1) {
  df1 <- filter(df0, (colname) == subclass)
  mgrTableNEW(df1, sortz = sortz)
}
It looks to me like it should work, but running mgrTableXv1(USmanagersY, MainAssetClass, "Commodities") gives me an evaluation error: object ‘MainAssetClass’ not found.
I kept getting error messages when I first started writing functions with dplyr and trying to pass function arguments to dplyr verbs. After a lot of troubleshooting and googling in the middle of the night one night, I came across this blog post from Colin Fay on tidy evaluation that saved me. Here I was introduced to the enquo() function.
mgrTableX <- function(df0, colname, subclass, sortz = 1) {
  colname <- enquo(colname)
  df1 <- filter(df0, (!!colname) == subclass)
  mgrTableNEW(df1, sortz = sortz)
}
If I do say so myself, mgrTableX() is a very cute little function. It takes the column name, filters by the criteria, and then calls mgrTableNEW() to return a table.
This function call produces the same results as mgrTableACORIGINAL(USmanagersY, "Commodities") above.
pandoc.table(mgrTableX(USmanagersY, MainAssetClass, "Commodities"), style = "rmarkdown")
## `summarise()` ungrouping output (override with `.groups` argument)
##
##
## |          AssetManager           | Total | SumTotal |
## |:-------------------------------:|:-----:|:--------:|
## |  NGP Energy Capital Management  |   2   |   310    |
## |         Geronimo Energy         |   1   |   300    |
## |     Energy Capital Partners     |   1   |   250    |
## |      Avenue Capital Group       |   1   |   150    |
## |     Quantum Energy Partners     |   3   |   142    |
## |            BlackRock            |   1   |   100    |
## |     Sprott Asset Management     |   1   |   100    |
## |    Bluescape Energy Partners    |   1   |    90    |
## |     Edge Natural Resources      |   1   |    75    |
## |       Lime Rock Partners        |   1   |    50    |
## |      Natural Gas Partners       |   1   |    50    |
## |   Five Point Capital Partners   |   1   |    40    |
## |         Denham Capital          |   1   |    30    |
## |     Energy & Minerals Group     |   1   |    25    |
## |   Mountain Capital Management   |   1   |    25    |
## |         EnCap Flatrock          |   1   |    20    |
## |        Blue Water Energy        |   1   |    10    |
## | Kayne Anderson Capital Advisors |   1   |    10    |
## |    Carnelian Energy Capital     |   1   |   7.5    |
## |         Corex Resources         |   1   |    0     |
## |        EnCap Investments        |   1   |    0     |
###Understanding more about tidy evaluation
A couple weeks after I found that blog post and started using enquo() I was lucky enough to attend an R-Ladies NYC meetup featuring a discussion by R guru and tidy data master Hadley Wickham. I was pleasantly surprised when Hadley spoke specifically about non standard evaluation and the enquo() function, because it gave me a fuller understanding of what I had already done.
The reason I had gotten error messages and needed to use enquo() is because one of the arguments I passed into mgrTableX() was automatically quoted by R. So in the above function call, R would automatically wrap MainAssetClass in quotes. (That’s standard evaluation.) I needed that argument to be evaluated with tidy evaluation instead. When using dplyr verbs, the column name can’t be a string, which is what happens when your function arguments are automatically quoted.
As I learned from Hadley, a good way to know if your argument is automatically quoted or not, is to check if it works on its own (outside of a function). If it doesn’t (like MainAssetClass, which is a column in a data frame and does not mean anything on its own), it is automatically quoted. If it can be evaluated outside a function (like the name of dataframe USmanagersY), it is an evaluated argument that won’t need enquo().
So I reassigned the mgrTableX() function argument colname with colname <- enquo(colname). Then when I needed to use it with filter(), I added !! (pronounced “bang bang”) to the beginning (!!colname). Then it works just the way I need it to.
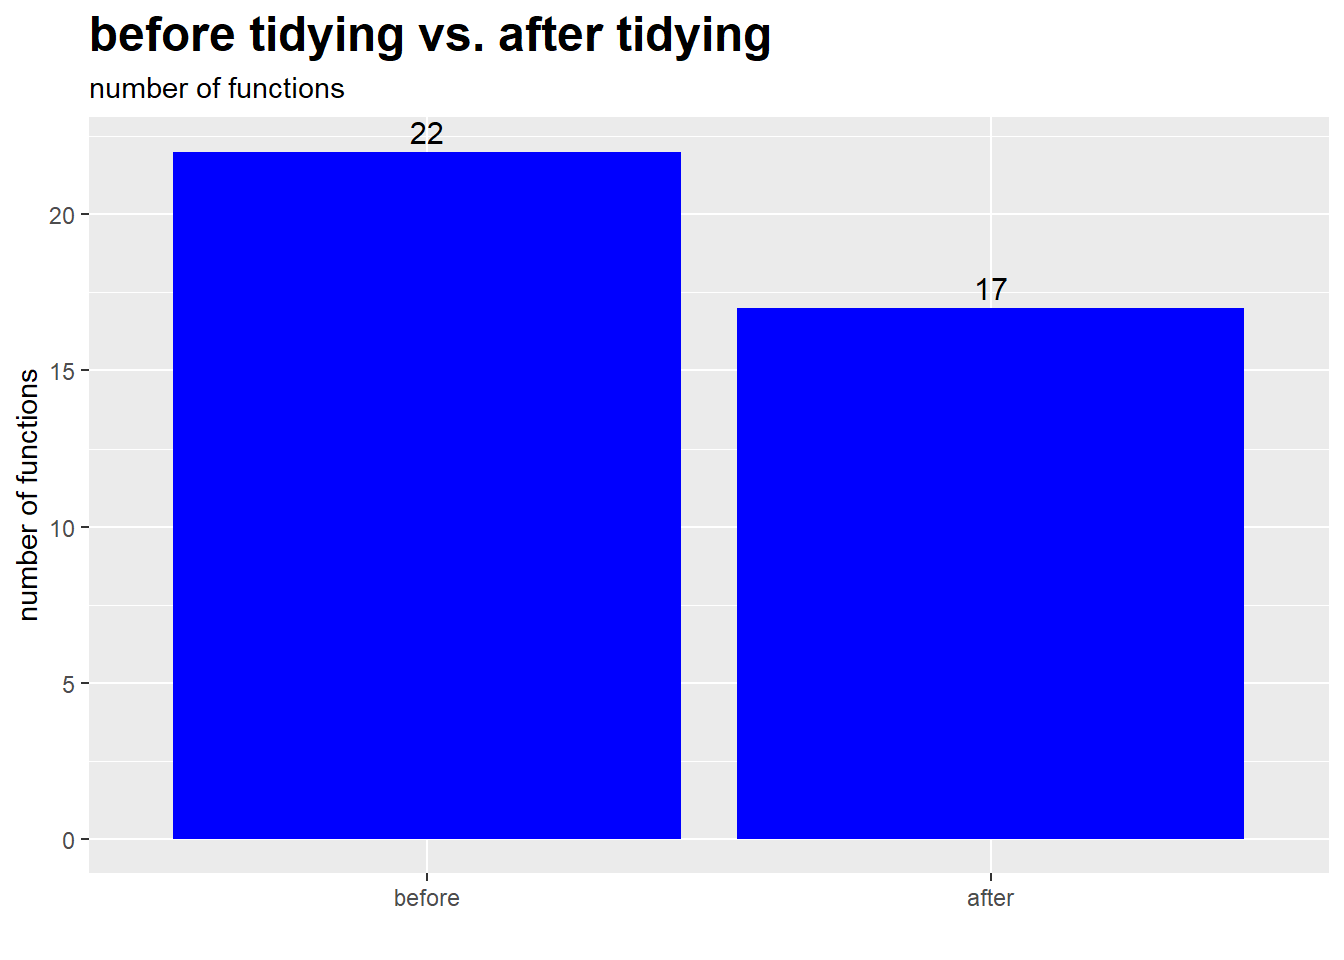
###Summary By all means I consider the tidying of my asset manager functions a success.
First of all, I was able to reduce the number of functions I needed from 22 to 17.
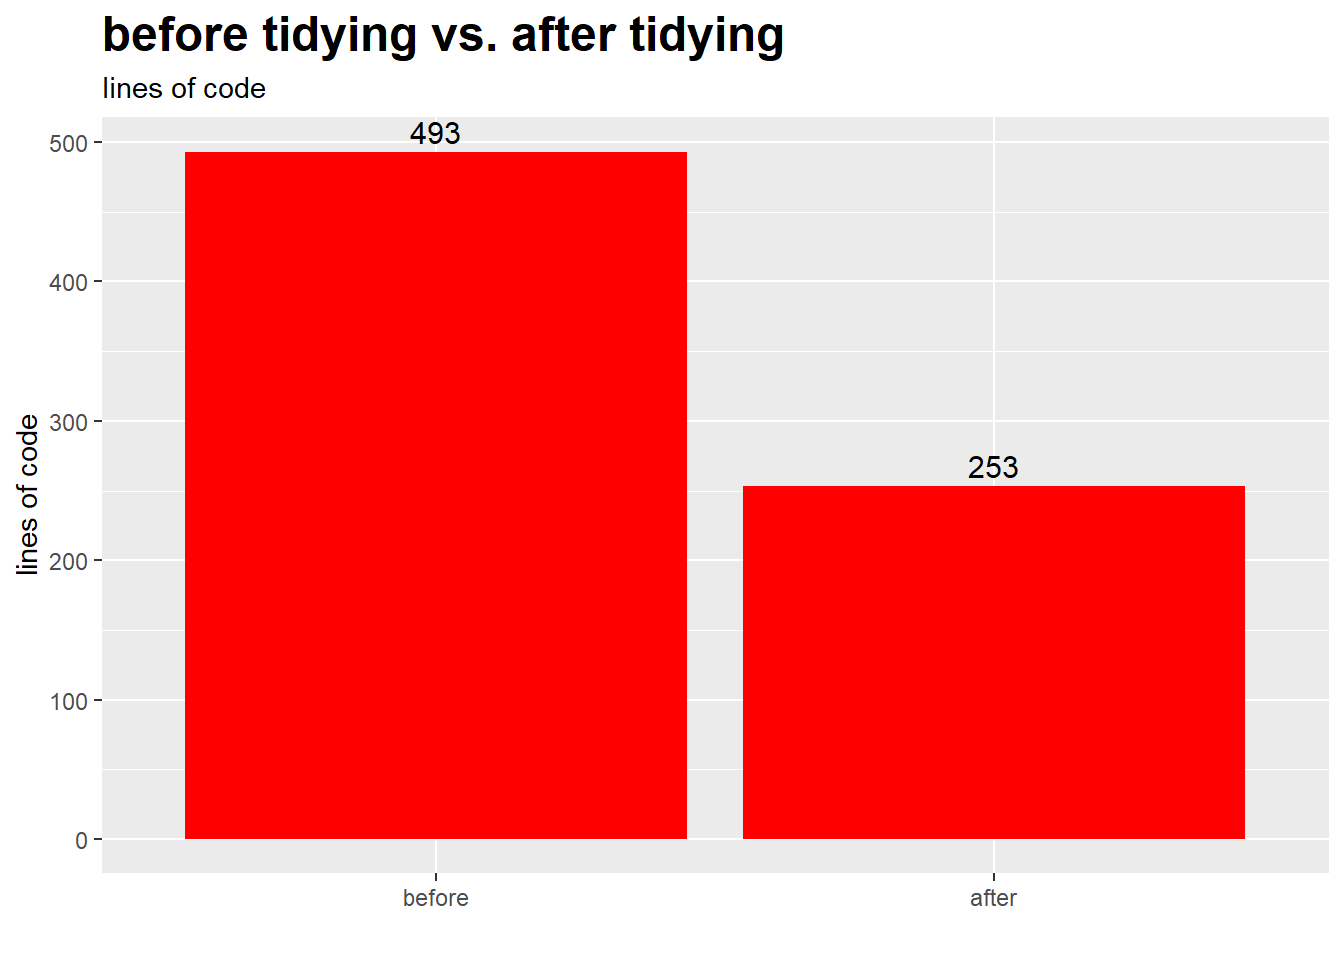
And perhaps more impressively, I reduced the lines of code by 49%, from an insane 493 lines down to just 253!
In conclusion, I am very pleased with the progress I made implementing tidyverse practices into my old functions. If you have some old functions that you’ve been using for years, it’s worth the time to look at them and figure out how to make them more efficient.