Web scraping
Web scraping is something I’ve been wanting to do for a long time but hadn’t gotten around to until recently. I could have used it many times to make my life easier, most memorably about three years ago when I copied/pasted a month’s worth of Food Network schedules into Excel. So it was about time I finally figured it out.
rvest
The rvest package is great when you need to scrape (harvest) data from html web pages. It uses css selectors or xpaths to identify the data you want to extract.
library(rvest)I prefer using css. I ’ve written css before and it makes more sense to me to use css selectors. You can use a browser extension like SelectorGadget to identify the css selector you need. I do this, but I end up looking at the page source code a lot anyway.
Broad City episode data
One of my favorite shows, Broad City, aired its final episode recently and I wanted to celebrate the occasion with some charts. So with my new love and knowledge of webscraping, I headed over to the show’s IMDb page and grabbed some basic data for every episode. To do this I needed a few more packages:
library(purrr)
library(tidyr)
library(dplyr)
I looped through each season’s page and used the html_nodes(), html_attr(), and html_text() functions with css selectors as arguments to extract the content I needed. Here is the code I used to get basic details on each episode of Broad City:
# scrape episode data for seasons 1-5 of Broad City
bc_episodes <- c()
for(s in 1:5){
  url <- paste0("https://www.imdb.com/title/tt2578560/episodes?season=", s)
  bc_html <- read_html(url)
  episode_number <- bc_html %>%
    html_nodes('.image') %>%
    html_text()
  bc_episodes <- bc_html %>%
    html_nodes('.info') %>%
    map_df(~list(airdate = html_nodes(.x, '.airdate') %>%
                   html_text(),
                 title = html_nodes(.x, 'strong a') %>%
                   html_attr("title"),
                 summary = html_nodes(.x, '.item_description') %>%
                   html_text(),
                 rating = html_nodes(.x, '.ipl-rating-star.small span.ipl-rating-star__rating') %>%
                   html_text() %>%
                   {if(length(.) == 0){NA} else {.}},
                 votes = html_nodes(.x, '.ipl-rating-star__total-votes') %>%
                   html_text() %>%
                   {if(length(.) == 0){NA} else {.}})) %>%
    mutate(episode_number = episode_number) %>%
    rbind(bc_episodes, .)
}
And now to clean that harvested data up a little. First I need the stringr package.
library(stringr)Mostly I just need to remove some extra characters, and separate the season and episode numbers which were captured in the same element from the website.
# Cleaning
broad_city <- bc_episodes %>%
  mutate(airdate = dmy(airdate),
         rating = as.numeric(rating),
         votes = as.numeric(str_remove_all(votes, "[()]")),
         episode_number = str_remove_all(episode_number, "\\n") %>%
           trimws() %>%
           str_remove("Add Image ")) %>%
  separate(episode_number, c("season", "episode"), ",") %>%
  mutate(season = as.numeric(str_remove(season, "S")),
         episode = as.numeric(str_remove(episode, "Ep")),
         total_episode = row_number(),
         season = paste0("season ", season))
This gives me a nice tidy dataset with the following information for each episode:
- original air date
- episode title
- season number
- episode number
- average rating by IMDb users
- number of votes by IMDb users
Broad City charts
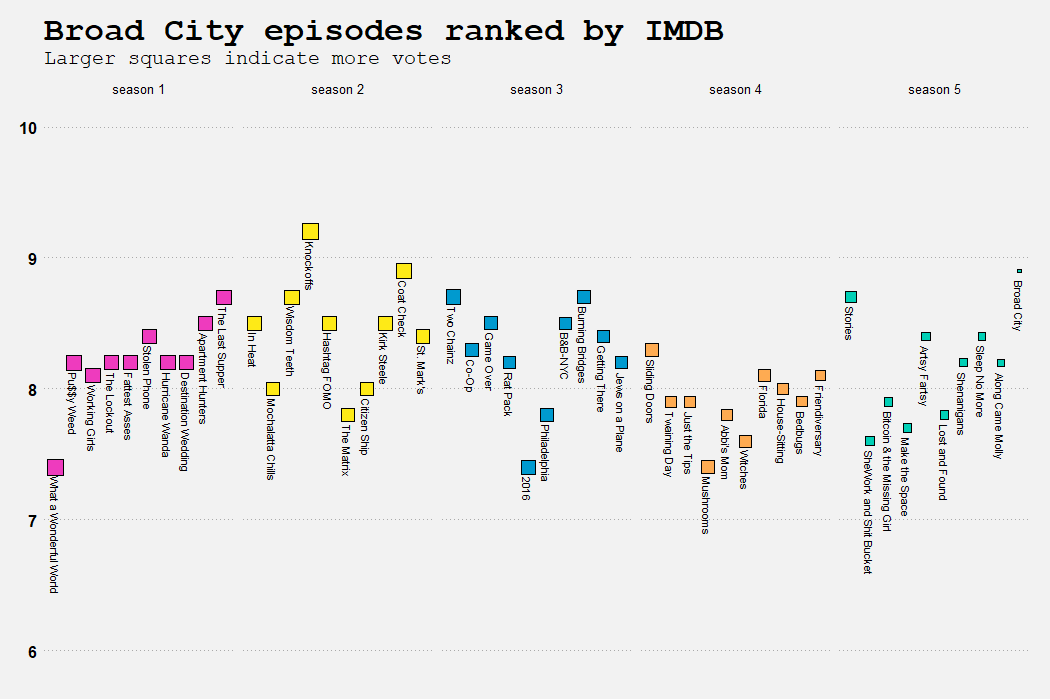
Now I have the data I need to make these two charts. The first one shows all 50 episodes and their rankings on IMDb. No surprise that most of them are ranked pretty high, as they’re all hilarious.
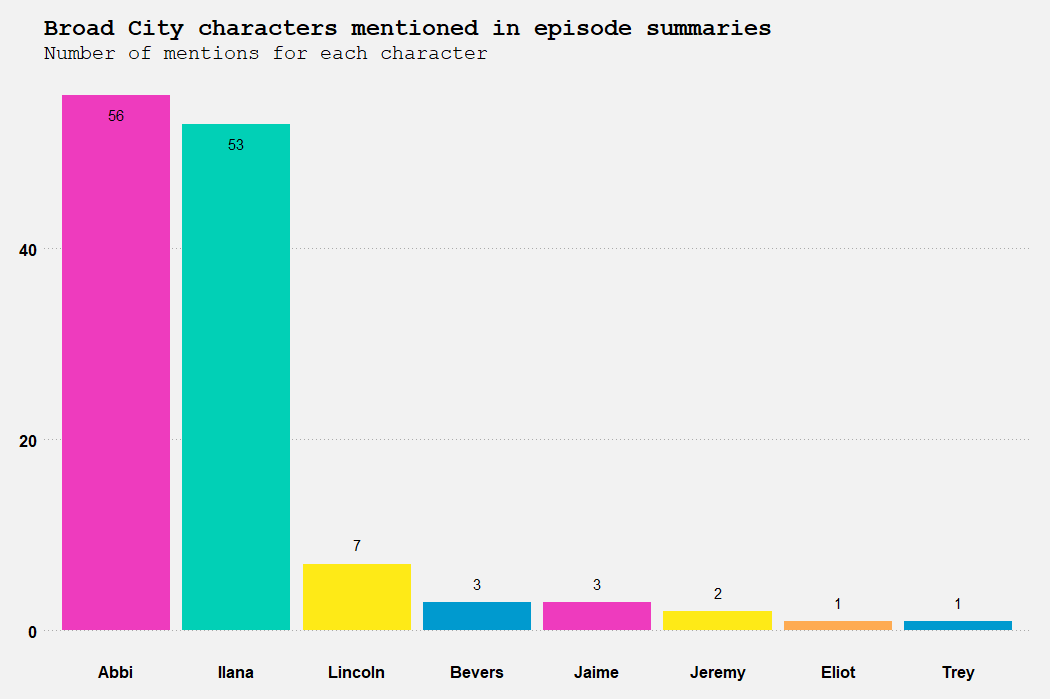
The second one is a bar chart of the number of times each character is mentioned in all 50 episode summaries. Obviously Abbi and Ilana are mentioned a lot more than everyone else combined, as this is a buddy comedy.
If you want to see the full code to collect the data and reproduce these charts, check it out here.
Next on my web scraping agenda
In addition to the Broad City episode data, I’ve also recently been scraping Long Island Railroad station information (which I hope to share here soon), the subjects of posts on one of my favorite celebrity gossip websites, and the Food Network schedule (to see how often Guy Fieri shows are on).
I also had a few failed attempts at web scraping when I encountered websites that use JavaScript-rendered content instead of having the actual content in their html code. So on my next web scraping episode I’ll figure out what to do in those cases.