Pixel Art
For some reason it's oddly satisfying for me to make pixel art in R. Maybe it's like doing a jigsaw puzzle or building with Lego. Or like watching my crochet projects get bigger. I like to see progress! I always check it while I go and watch the image work up step by step. This is my process:
Setting up the pixel canvas
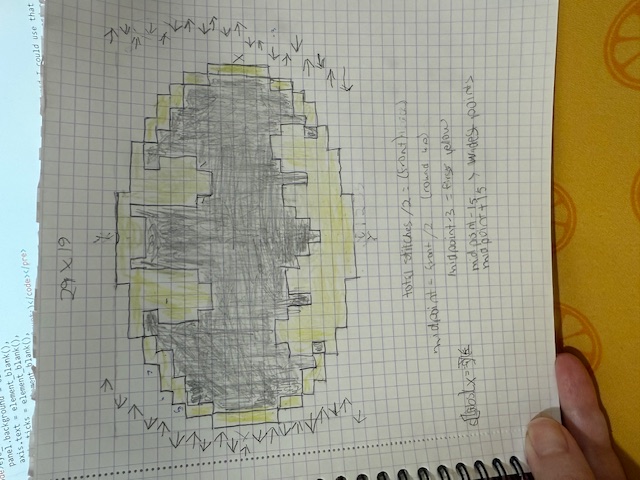
I start by getting the length and width that I'll need in pixels. This Batman logo is 29 by 19 pixels. (The notes are mostly about where I need to start the logo on a sweater vest I'm making.)
As always with my pixel art projects, I'm using the ggplot2 package to create the graphics, and the dplyr package for assigning the different colors.
library(ggplot2)
library(dplyr)
Then I make a dataframe with all possible x and y coordinates. I usually make x = 0 and y = 0 the midpoint to help assign symmetrical patterns more efficiently.
The c coloumn will determine the color so for now we're starting with every pixel getting the background color by assigning them all 0.
#populate data frame with coordinates
              x <- rep(-16:16, each = 23)
              y <- rep(-11:11, times = 33)
              c <- rep(0, 759)
              bruce_wayne <- data.frame(x, y, c)
Assigning different colors to different pixels
I always like to figure out the mid point and look for patterns and symmetry when I code these out. Sometimes it's easier to assign the colors by x values and other times by y values. This logo has some symmetry so I utilized the absolute value function to assign x = 1 and x = -1, for example, at the same time whenever I could.
For the Batman logo, I decided it would be best to add the yellow layer first, then add the bat on top of it.
batman <- bruce_wayne %>%
  #add yellow background layer first
  mutate(c = case_when(
    (abs(y) %in% 0:2 & abs(x) %in% 0:14) ~ 1,
    (abs(y) %in% 3:4 & abs(x) %in% 0:13) ~ 1,
    (abs(y) == 5 & abs(x) %in% 0:12) ~ 1,
    (abs(y) == 6 & abs(x) %in% 0:11) ~ 1,
    (abs(y) == 7 & abs(x) %in% 0:9) ~ 1,
    (abs(y) == 8 & abs(x) %in% 0:7) ~ 1,
    (abs(y) == 9 & abs(x) %in% 0:3) ~ 1,
    TRUE ~ c

    batman %>%
  ggplot(aes(x, y, fill = factor(c))) +
  geom_point(size = 12, shape = 22, color="transparent") +
  scale_fill_manual(values = c( bg, "yellow", "black")) +
  pix_theme
When I add just the yellow layer and run the ggplot function it looks like this:

Now let's add the batcode! Just adding on to the batman alogorithm to re-assign some of the yellow pixels black:
batman <- bruce_wayne %>%
  #add yellow background layer first
  mutate(c = case_when(
    (abs(y) %in% 0:2 & abs(x) %in% 0:14) ~ 1,
    (abs(y) %in% 3:4 & abs(x) %in% 0:13) ~ 1,
    (abs(y) == 5 & abs(x) %in% 0:12) ~ 1,
    (abs(y) == 6 & abs(x) %in% 0:11) ~ 1,
    (abs(y) == 7 & abs(x) %in% 0:9) ~ 1,
    (abs(y) == 8 & abs(x) %in% 0:7) ~ 1,
    (abs(y) == 9 & abs(x) %in% 0:3) ~ 1,
    TRUE ~ c
  )
  ) %>%
  # add the bat
  mutate(c = case_when(
    (abs(y) %in% 0:2) & (abs(x) %in% 0:13) ~ 2,
    (y == 3) & ( abs(x) %in% c(0:3, 6:12)) ~ 2,
    (y == -3) & ( abs(x) %in% c(0:6, 9:12)) ~ 2,
    (y == 4) & ( abs(x) %in% c(0:2, 7:12)) ~ 2,
    (y == -4) & ( abs(x) %in% c(0:2, 5, 10:12)) ~ 2,
    (y == 5) & ( abs(x) %in% c(0:2, 7:10)) ~ 2,
    (y == -5) & ( abs(x) %in% c(0, 1, 5, 10)) ~ 2,
    (y == 6) & ( abs(x) %in% c(0:2, 7:8)) ~ 2,
    (y == -6) & ( abs(x) %in% c(0, 9)) ~ 2,
    (y == 7) & ( abs(x) %in% c(0:2, 6:7)) ~ 2,
    (y == 8) & ( abs(x) == 2) ~ 2,

    TRUE ~ c
  )
  )
Now rerun the ggplot2 code and we get this!
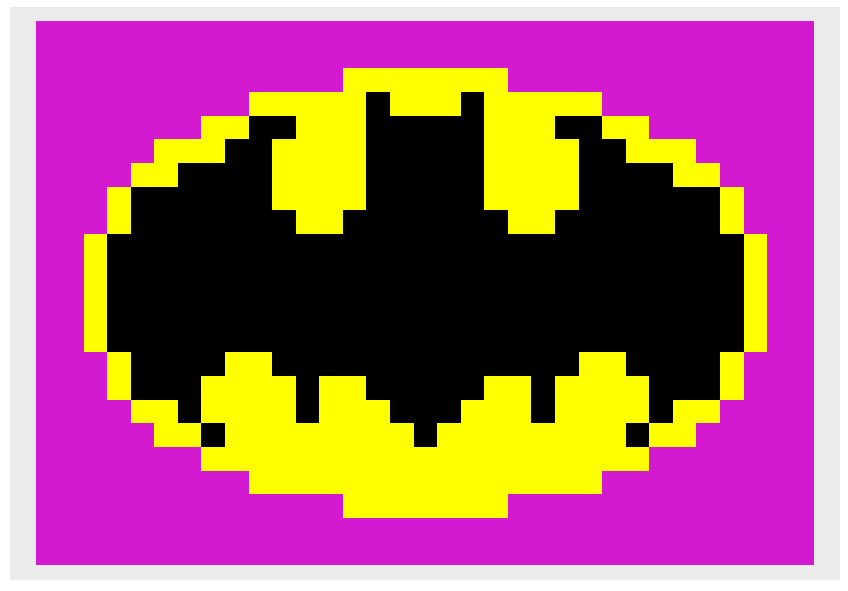
I like to re-run the plot after every line or two of code I write to see the pattern fill in gradually. So satisfying!
Customising your graphics
Here's the theme and background color I used. I picked that color because it's close to the yarn color I'm using in my sweater. Batman colors are standard but I usually go wild picking colors for pixel graphics. The infinte possibilities are almost overwhelming!
bg <- "#d31ad0"

#blank theme
pix_theme <- theme(panel.grid = element_blank(),
                   axis.text = element_blank(),
                   axis.ticks = element_blank(),
                   axis.title = element_blank(),
                   legend.position = "none"
)
Check out some more of my pixel code
If you want to see some more of my pixel code, check it out on my github pixel repository and let me know if you use any of it!