I’m not finished working on hexagons yet. If I’m being honest, I may never finish.
Perler beads
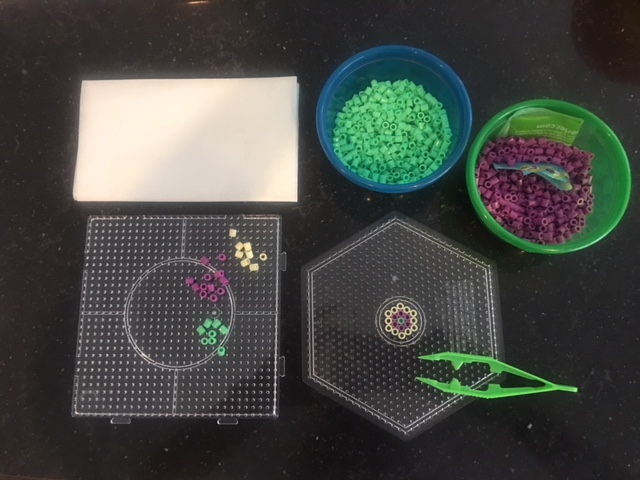
Recently, as I explored crochet shapes and wrote a hexagon plotting function to visualize them with ggplot2, I was drawn to the perler bead hexagons I had already, and even made a few more. Holding them and spinning them around helped me figure out the algorithm. So I feel it was a natural progression to continue on my hexagon journey with perler beads. So now I’m going to use R to create hexagon perler bead patterns.
I love crafting with perler beads (also known as melty beads or hama beads). It’s generally a pretty simple craft, although its applications can potentially be quite complicated (have a search on instagram or pinterest). You simply arrange the beads on a pegboard according to a pattern, then cover them with a special paper and iron them to fuse them together.
Perler bead hexagons
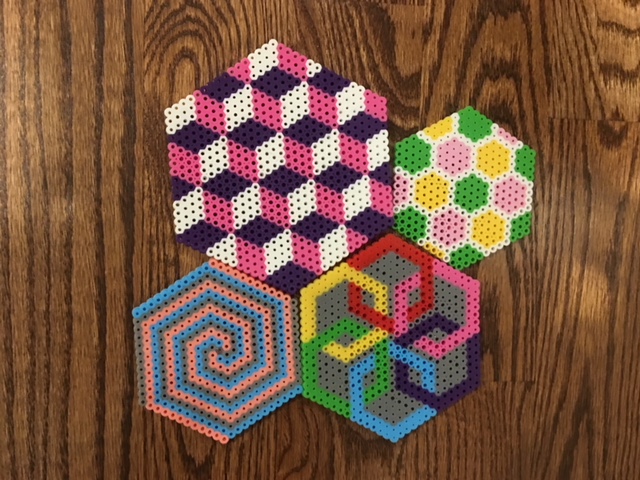
Square pegboards are definitely the most commonly used perler bead board, but hexagon, circle, and star shaped boards are also very easy to find. Here are some hexagons I’ve made. I find some of the patterns kind of mesmerizing, both to make and to look at. You could use these as coasters! It’s fun to keep one at your desk that you can spin around when it’s not holding a drink.
My goal right now is to expand on my original hexagon function, (which returns x and y coordinates for points on a hexagon), to produce other variables that will help us determine the color of that point when we plot it, thereby creating a design.
Hexagon function (blank design)
Loading ggplot2 of course, and also dplyr to help create those color-determining variables, and a blank theme.
library(ggplot2)
library(dplyr)
hex_theme <- theme(panel.grid = element_blank(),
panel.background = element_rect(fill = "white"),
axis.text = element_blank(),
axis.ticks = element_blank(),
axis.title = element_blank(),
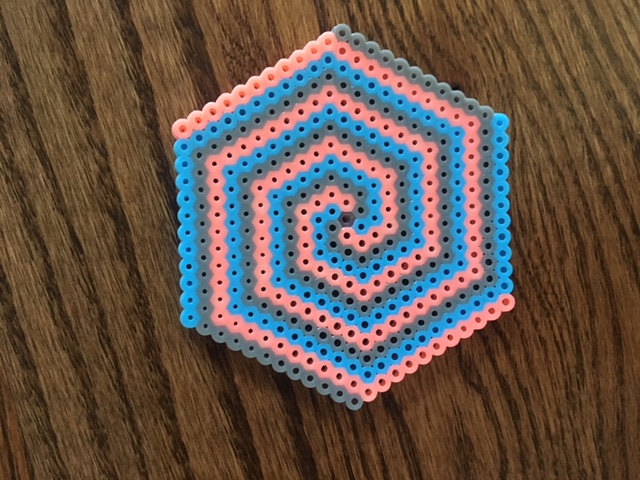
legend.position = "none")In my previous post, I wrote a function to plot a spiral hexagon, but I have to modify it here because hexagon perler bead pegboards are not in a spiral pattern. Rather, the pegs on the board are arranged in a series of nested hexagons.
Fortunately it’s really easy to modify the function. I just have to relocate two lines of code outside of a nested loop.
    t <- t + distance / sides
    r <- t * (sqrt(3) / 2)
t and r are the reference points used to calculate the points on the hexagon. t is the length of each of the hexagon’s sides. r is the distance from the center of the hexagon to the midpoint of one of its sides.
NOTE: I’m using the word “rounds” to refer to the nested hexagons. The 6 points surrounding the center point of the hexagon plot are round 1; the 12 points surround round 1 are round 2, and so on until you reach the outer-most hexagon.
When I plotted a spiral hexagon, I recalculated r and t six times per round. Now I just have to recalculate once per round. Here is the function:
hex_points <- function(n, distance = 0.5) {
  sides <- 6
  t <- 0.1
  r <- t * (sqrt(3) / 2)
  x <- c(0)
  y <- c(0)
  for(i in 1:n) {
    for(j in 1:sides) {
      xx <- c(0, r, r, 0, -(r), -(r), 0)
      yy <- c(t, (t / 2), -(t / 2), -(t), -(t / 2), (t / 2), t)
      newx <- seq(xx[j], xx[j+1], length.out = i+1)
      newy <- seq(yy[j], yy[j+1], length.out = i+1)
      x <- c(x, newx[-1])
      y <- c(y, newy[-1])
    }
    t <- t + distance / sides
    r <- t * (sqrt(3) / 2)
  }
  return(data.frame(cbind(x, y)))
}
And here is a plot of a blank hexagon perler bead pattern, if you want to be old school and print it out and color in the points by hand.
 hex_points(12) %>%
  ggplot(aes(x = x, y = y)) +
  geom_point(size = 6, color = "black", shape = 1) +
hex_theme 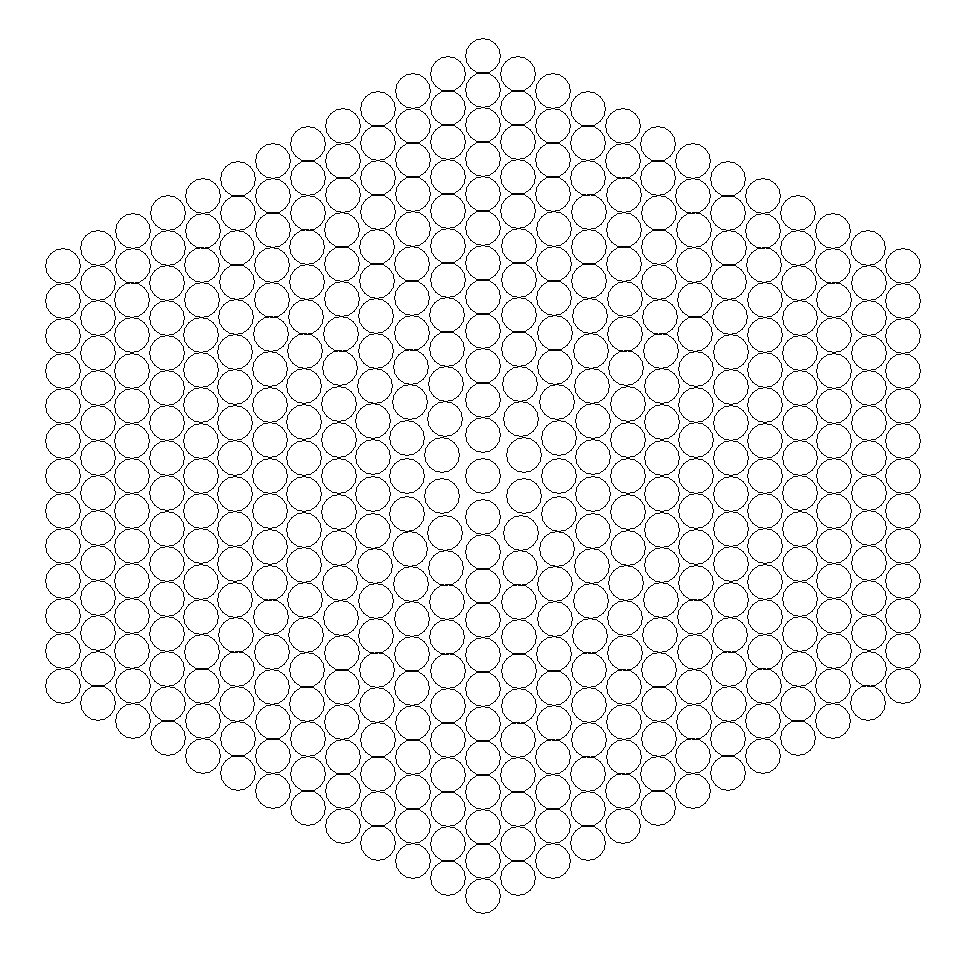
Hexagon design function #1
I really enjoy this hexagon design so I wanted to plot it.
Let’s start by creating a color palette to use for it. I’ll make the center point black, and all other points will be either blue, orange or grey, depending on their position.
hex1Colors <- c("#D5DBDB", "#33BBFF", "#FFA533")
hex1Palette <- c("black", rep(hex1Colors, 2))
Here is the function.
hex_points1 <- function(n, distance = 0.5) {
  sides <- 6
  t <- 0.1
  r <- t * (sqrt(3) / 2)
  x <- c(0)
  y <- c(0)
  rnd <- c(0)
  hexion <- c(0)
  for(i in 1:n) {
    rnd <- c(rnd, rep(i, i*sides))
    new_rnd <- i %% 3
    if(new_rnd == 0) {
      col_order <- c(1, 2, 3)
    } else if(new_rnd == 1) {
      col_order <- c(2, 3, 1)
    } else if(new_rnd == 2) {
      col_order <- c(3, 1, 2)
    }
    col_order <- rep(col_order, times = 2)
    new_hexion <- rep(col_order, each = i)
    hexion <- c(hexion, new_hexion[-1], new_hexion[1])
    for(j in 1:sides) {
      xx <- c(0, r, r, 0, -(r), -(r), 0)
      yy <- c(t, (t / 2), -(t / 2), -(t), -(t / 2), (t / 2), t)
      newx <- seq(xx[j], xx[j+1], length.out = i+1)
      newy <- seq(yy[j], yy[j+1], length.out = i+1)
      x <- c(x, newx[-1])
      y <- c(y, newy[-1])
    }
    t <- t + distance / sides
    r <- t * (sqrt(3) / 2)
  }
  return(data.frame(cbind(x, y, rnd, hexion)))
}
This function produces two variables that the blank function did not: rnd and hexion. So rnd is the round (as defined above), which helps us to calculate the other variable, hexion, which will determine the color of the point when we plot it. So let’s plot it:
hex_points1(12) %>%
  mutate(hexion = as.factor(hexion)) %>%
  ggplot(aes(x = x, y = y, col = hexion)) +
  geom_point(size = 6) +
  scale_colour_manual(values=hex1Palette) +
  hex_theme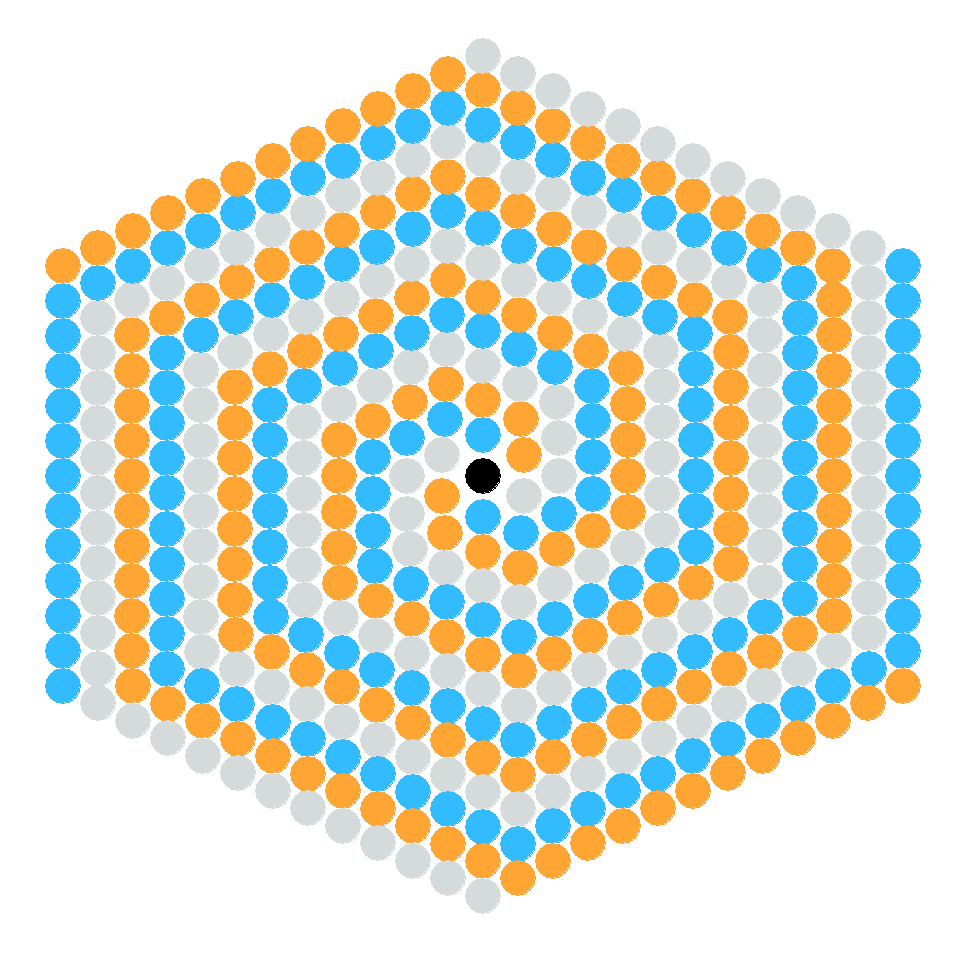
Hexagon design function #2
This function is for a design I haven’t made with perler beads yet, but I saw it on pinterest and wanted to plot it. Here’s a color palette for it:
hex2Colors <- c( "#8ffb65", "#ff55f8", "#428789")
hex2Palette <- c("black", rep(hex2Colors, 2))
Here is the function. This function returns one more value than the previous one: rnd, which will help us determine each point’s alpha (transparency) when we make the plot.
hex_points2 <- function(n, distance = 0.5) {
  sides <- 6
  t <- 0.1
  r <- t * (sqrt(3) / 2)
  x <- c(0)
  y <- c(0)
  rnd <- c(0)
  hexion <- c(0)
  for(i in 1:n) {
    rnd <- c(rnd, rep(i, i*sides))
    for(j in 1:sides) {
      xx <- c(0, r, r, 0, -(r), -(r), 0)
      yy <- c(t, (t / 2), -(t / 2), -(t), -(t / 2), (t / 2), t)
      newx <- seq(xx[j], xx[j+1], length.out = i+1)
      newy <- seq(yy[j], yy[j+1], length.out = i+1)
      hexion <- c(hexion, rep(j, (i * sides / 6)))
      x <- c(x, newx[-1])
      y <- c(y, newy[-1])
    }
    t <- t + distance / sides
    r <- t * (sqrt(3) / 2)
  }
  return(data.frame(cbind(x, y, rnd, hexion)))
}
Now to plot the design, right after mutating the rnd values so that they indicate whether a point’s round number is even or odd, to determine the transparency of the point:
hex_points2(12) %>%
  mutate(hexion = as.factor(hexion),
         rnd = ifelse(rnd %% 2 == 0, 1, 0)) %>%
  ggplot(aes(x = x, y = y, col = hexion, alpha = rnd)) +
  geom_point(size = 6) +
  scale_colour_manual(values = hex2Palette) +
  scale_alpha(range = c(0.5, 1.0)) +
  hex_theme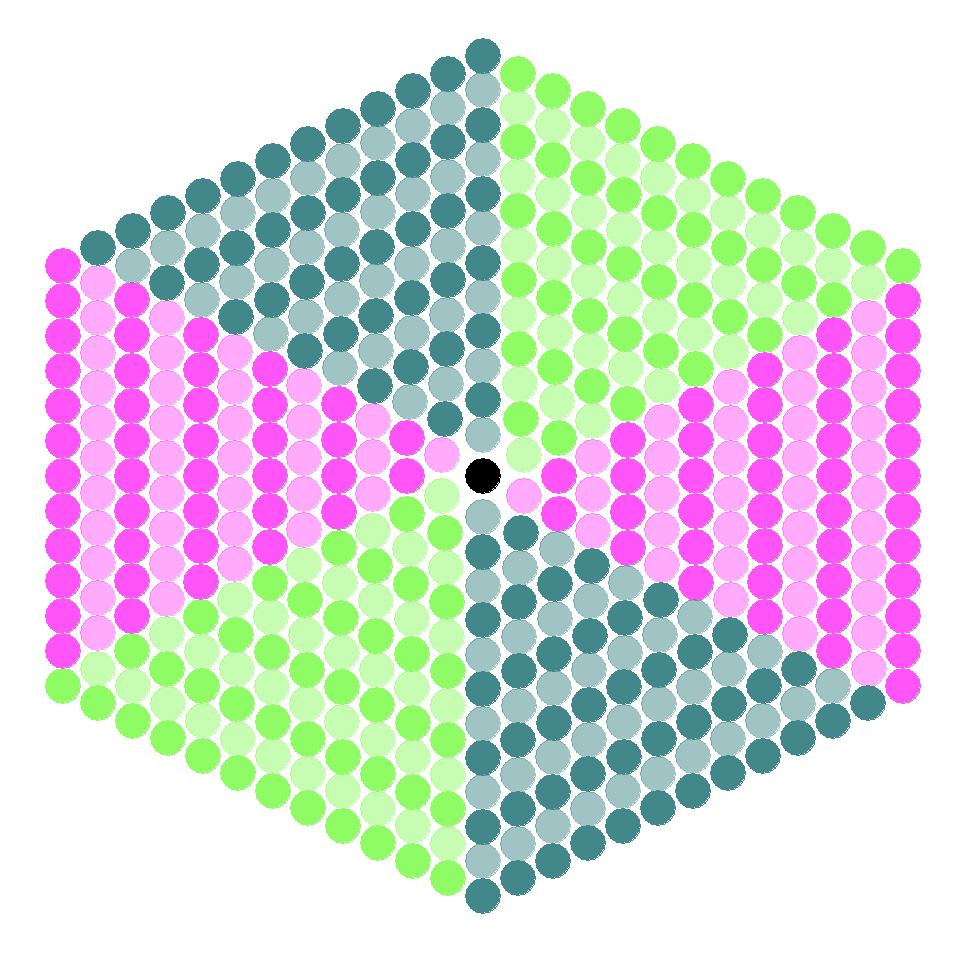
Future hexagon designs
I’m never going to stop making perler bead hexagons, so I definitely want to do more of these and will hopefully post more design functions in the future.