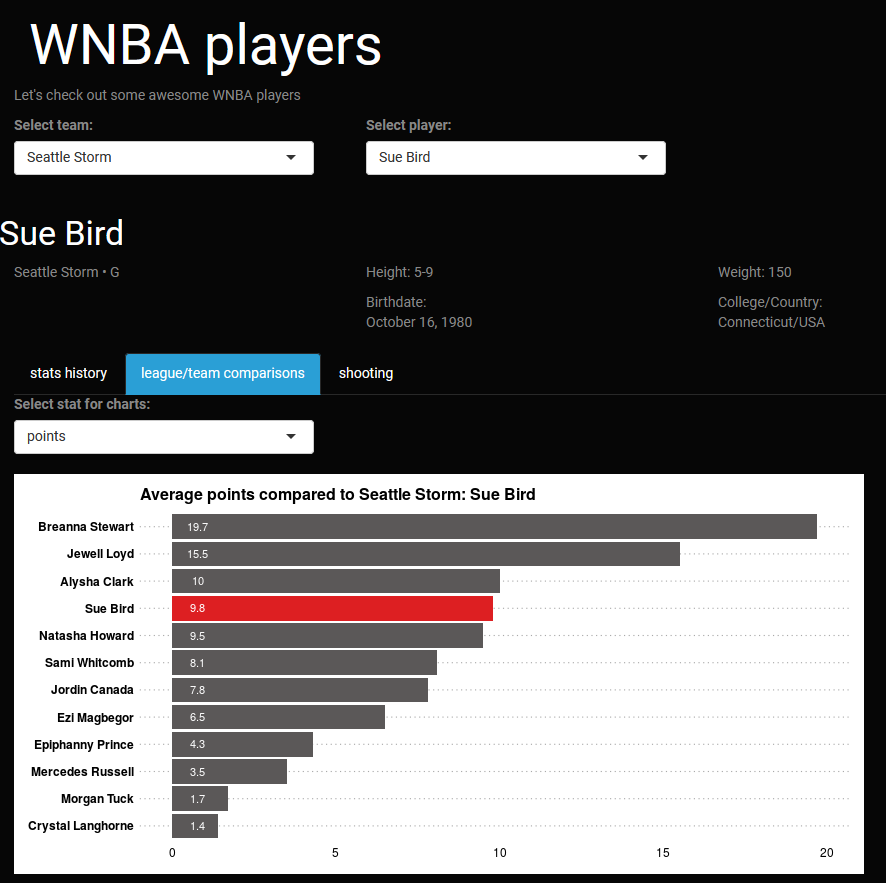
WNBA app
Currently I am working on a WNBA app that allows you to view history, team and league comparison, and shooting data for each active WNBA player. Made with R and shiny.
COVID data dashboard
One of my latest projects is a COVID-19 data platform focused on county-level data for New York State. This is made with R and shiny.
![]()
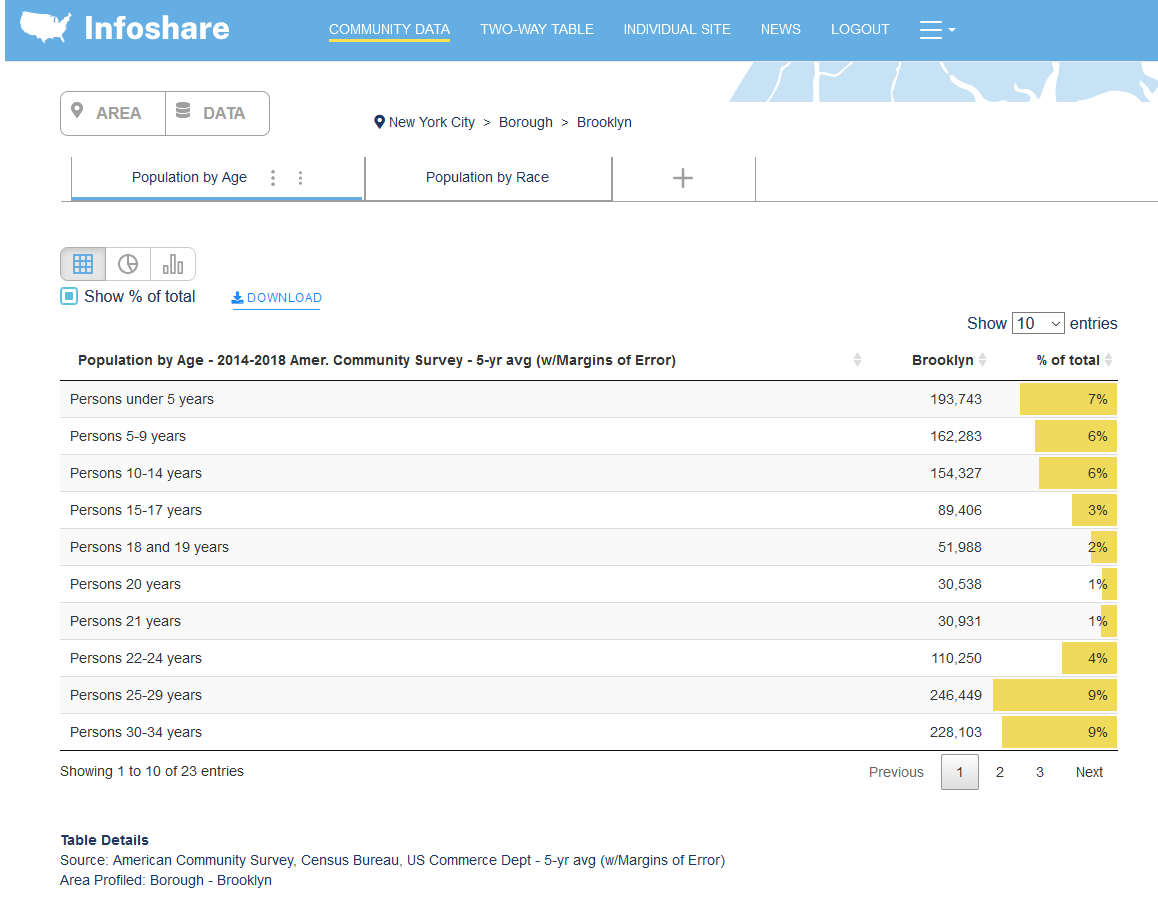
Infoshare
Check out the latest version I’m working on for Infoshare Online - a data search tool that lets planners, community activists, teachers, students, researchers, and ordinary citizens view and analyze a vast array of community and regional data. Made with R and shiny.
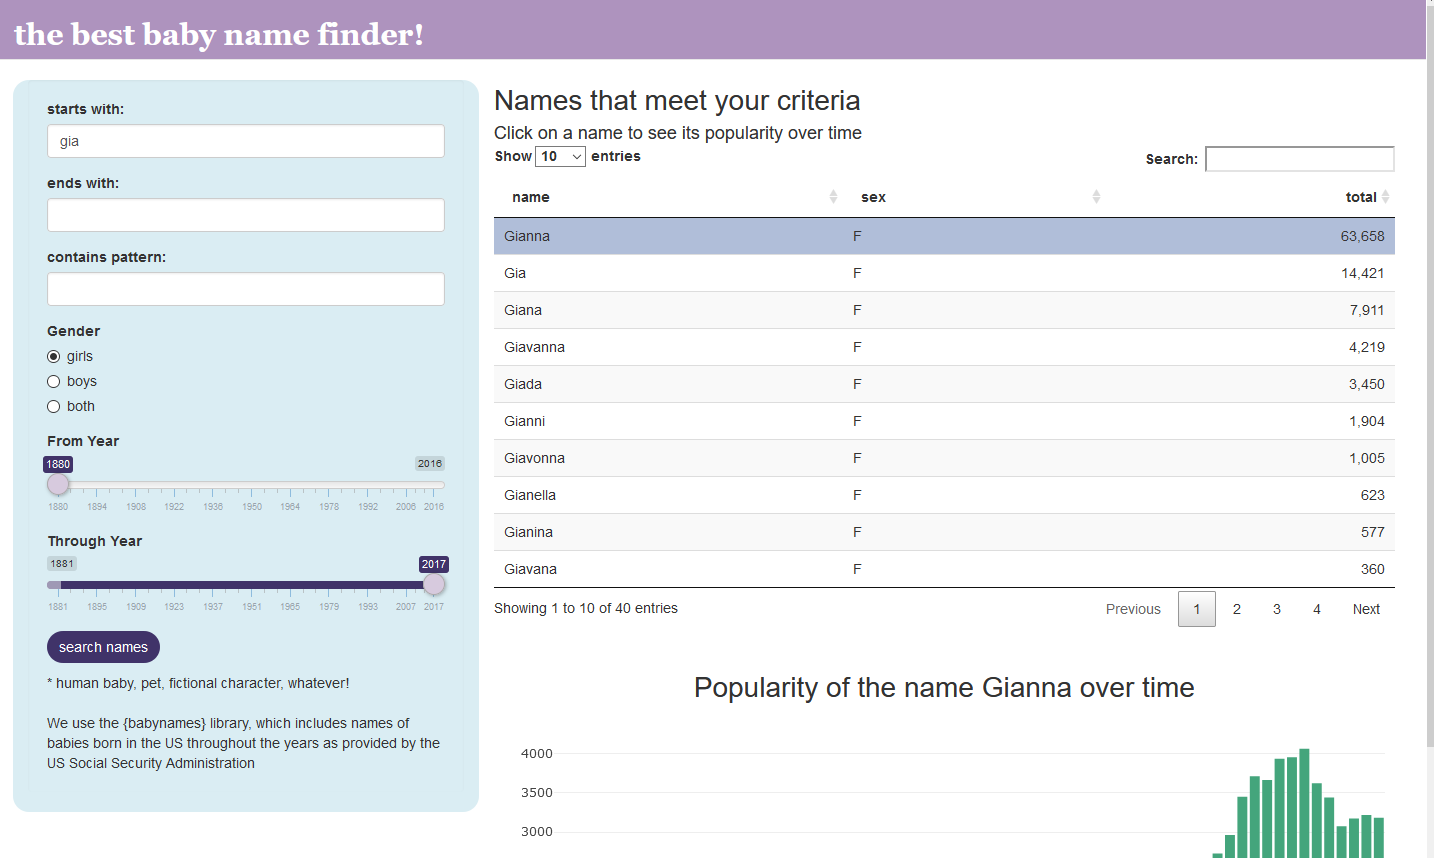
Name search app
I created a name search app that allows you to search by starting or ending letter, or letter pattern, and shows yearly trends in name popularity. Made with R and shiny, it accesses the database of baby names provided by US Social Security.
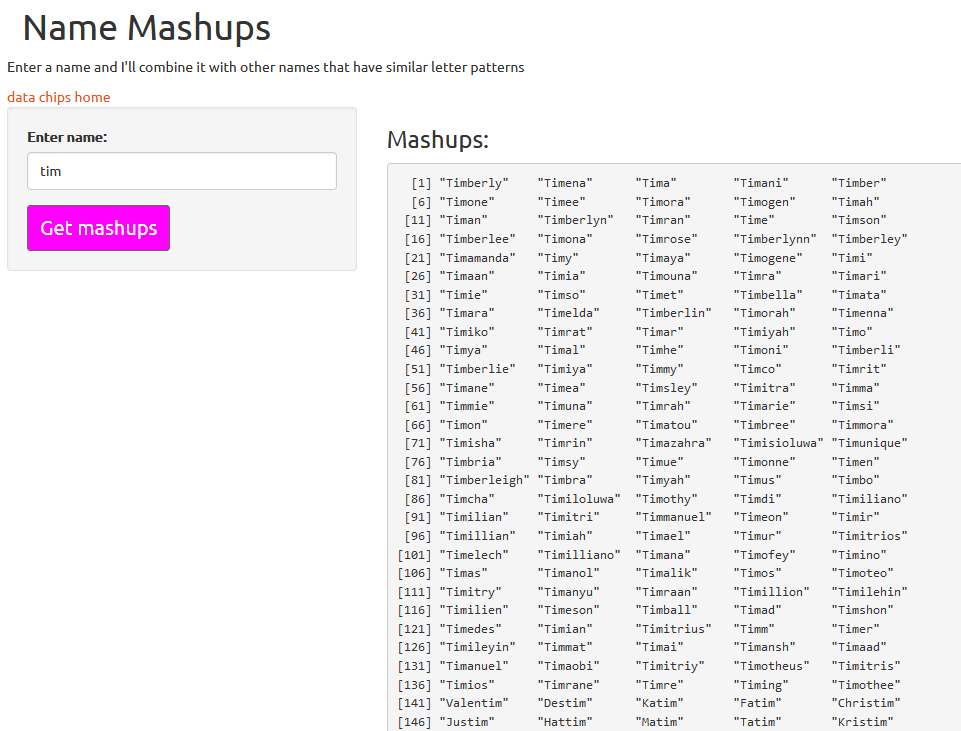
Name mashup app
Just for fun I created a name mashup app. Enter a name and the algorithm searches for names with similar letter patterns, returning a list of fun new names. Made with R and shiny, it accesses the database of baby names provided by US Social Security.
I’m mainly focusing on R now, but I’ve created a lot of work using different JavaScript libraries, too.
Interactive quarterly report
This is a sample report created with AMcharts JS.
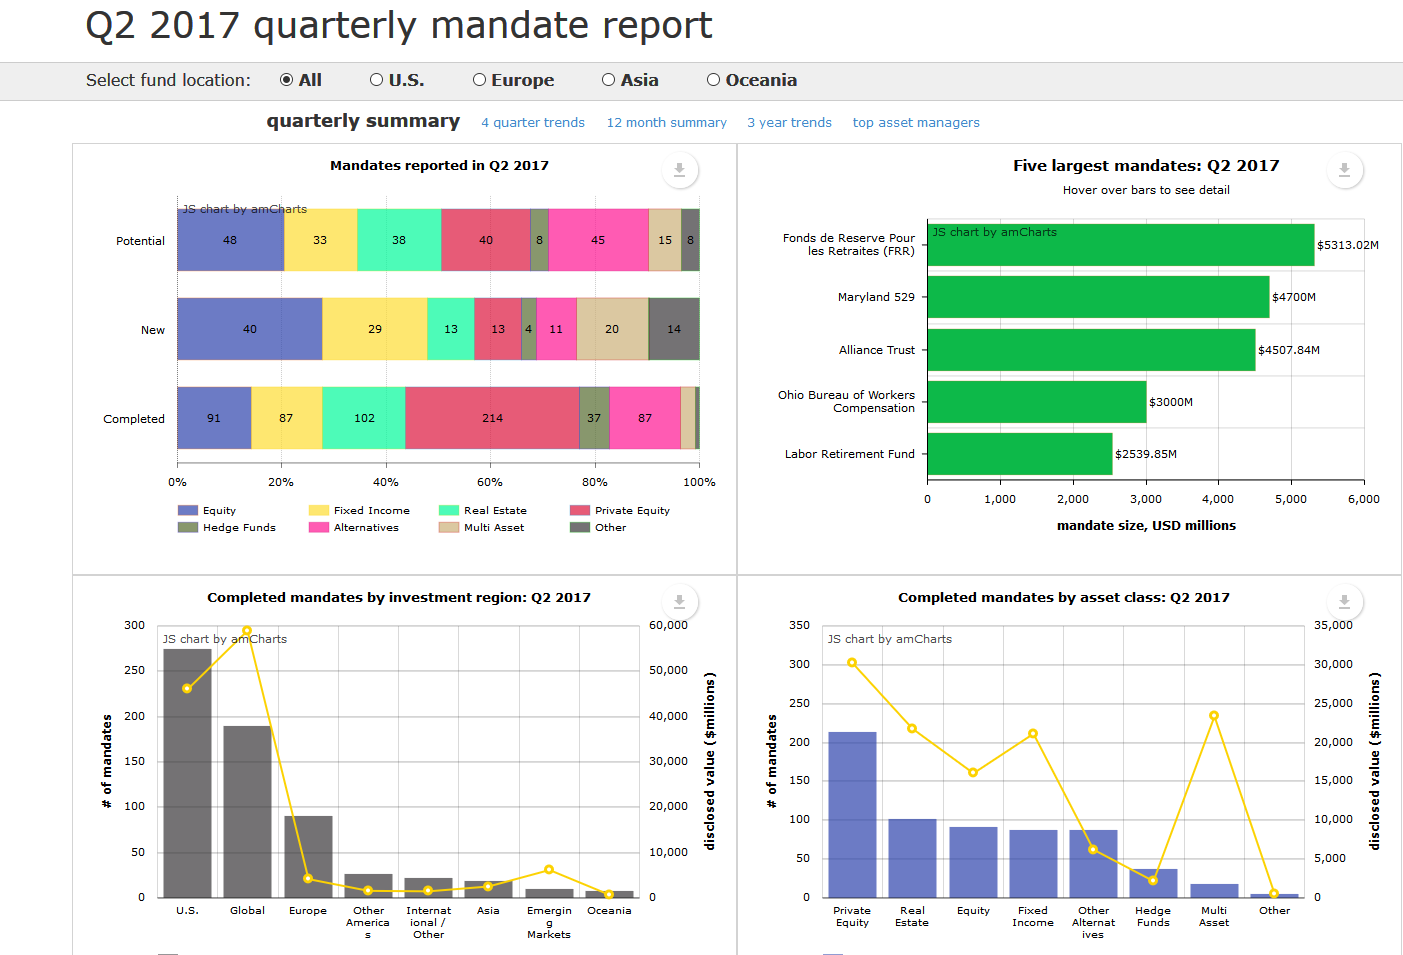
Chart Attack Symptoms
Click the King in the North graphic to see the charts I make for fun and/or exploratory purposes, some that I’ve made for work, and some pixel designs I’ve made with R.
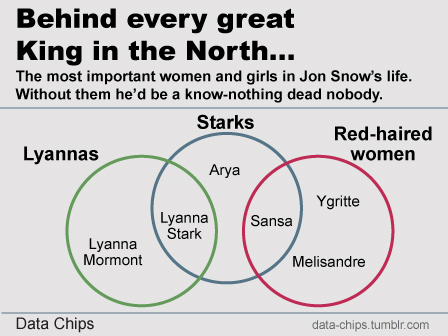
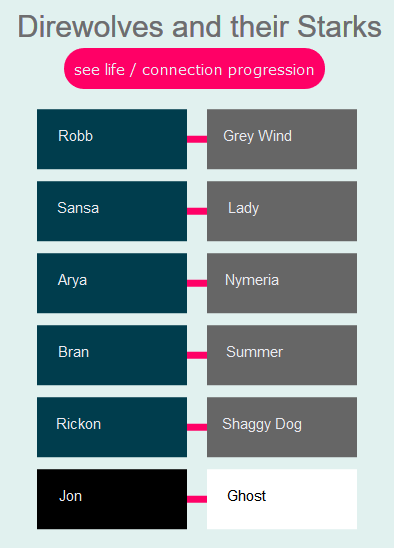
Direwolves and Starks
View my interactive Game of Thrones chart, made with svg.js and jQuery. Spoiler Alert: it details the Stark kids (including Jon Snow) and their connections to their Direwolves.