This summer has gone by fast. I can’t believe it’s been over a month since my last blog post on making perler bead hexagon patterns with R and ggplot2. I’m not going to use much R today, except one tiny prize if you make it to the end of this blog post.
New freelance gig
It’s been a while now since my previous long term freelance job ended. All freelance jobs have their advantages and disadvantages, but that one was good for me because I got to use R to completely rework an outdated process, making it faster and more efficient. I learned a lot about R and the tidyverse while I was doing this job. I even wrote my first blog post here about tidying the first functions to make them more efficient.
But now I have a new freelance gig that I’m excited about. I’m making data visualizations for a website and app, so this time I’m using JavaScript, which I hadn’t done in a while.
JavaScript-based data visualization
I’ve done web development and especially JS-based data visualizations before. (Take a look at my portfolio for examples!) and it’s a useful skill that I really enjoy mastering. Obviously R is still bae, so as much as possible even when I use other technologies, I use R to organize and manipulate data. And I use ggplot2 to create visual examples of what I plan to do in javascript, as it’s generally eaiser and faster to do it that way before getting client approval to reproduce as an interactive web visualization, which generally takes a lot more coding.
Two JS data visualization options: D3 and amCharts
I have used both D3 and amCharts in the past. They’re both JavaScript libraries used for creating data visualizations. You can use both to make charts, but that’s pretty much where their similarities end.
D3.JS
When I started this freelance job I was hoping I would use D3 because it provides endless possibilities. You start from scratch, so if you’re making a bar chart, you’re creating an svg (or canvas) with some rectangles, and then assigning data points to the rectangles that will manipulate their heights to produce a bar chart, with the help of scales that you create to fit them in the svg. I’m serious when I say D3 provides endless possibilities. Check out some examples of what people have made.
This project ended up using amCharts instead of D3. But after getting back into D3, I’ve been thinking of other projects I’d like to use it for. So check back with me soon for some more D3.JS!
amCharts
I’m using amCharts for this project, which is also interesting. With amCharts, you don’t have to start from scratch like D3. Rather, there are templates that you use for different types of charts. This can make it easier to get up and running, but you don’t get endless customization possibilities.
Regardless of the technology used, I’m excited to be part of this project, which I believe will be a useful website and app and I hope to share it with you soon.
Crochet washcloths
On a different note, I have recently become very interested in crocheting washcloths. My original plan was actually to crochet shower poofs. My first completed shower poof used a lot of yarn, but it looked super luxurious! Check it out:
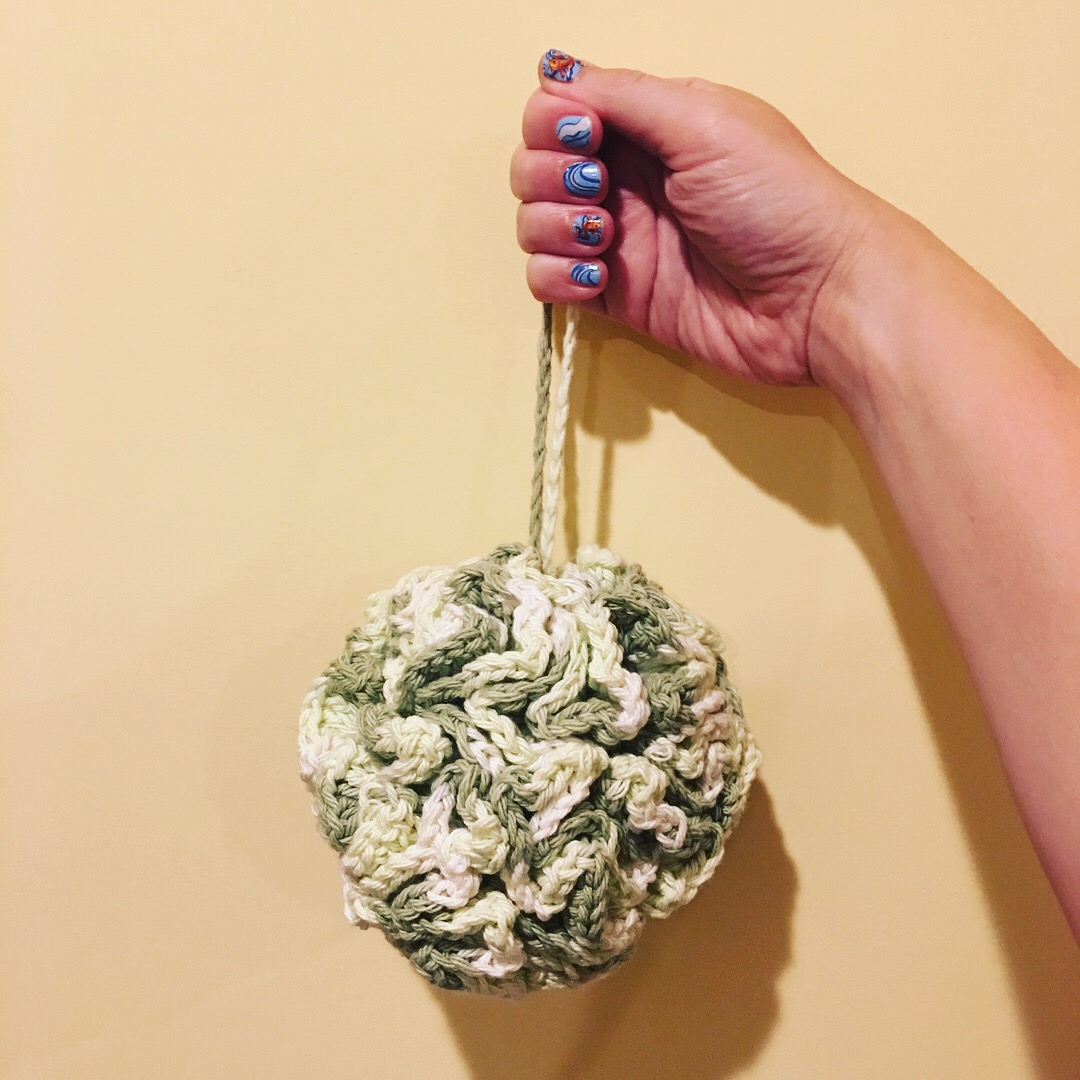
It looks so nice! Unfortunately, it took five days to dry. Not very practical. Granted I live in a relatively humid climate (especially in the summer months), but it’s just not what I needed. Plus the shower poof took a while to make because it uses so much yarn. Geometrically speaking, it’s really cool though.
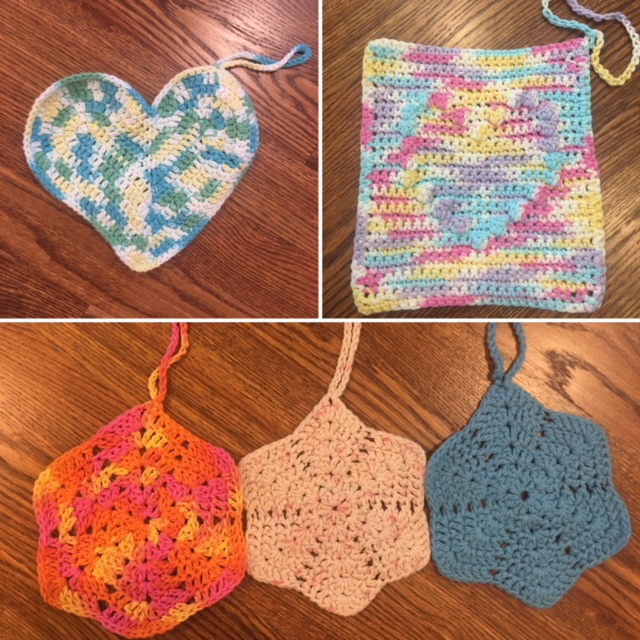
So I started making washcloths instead. They use less yarn, work up much faster, and perhaps most importantly, dry much faster. I have so many now. I just throw them in the laundry every few days after using them. Here’s a sample of some of my faves:
Pixel art in crochet projects
I’m trying to use a variety of different patterns for washcloths. I came across this great one on pinterest. I’ve made a variation of it a few times. Here’s one:
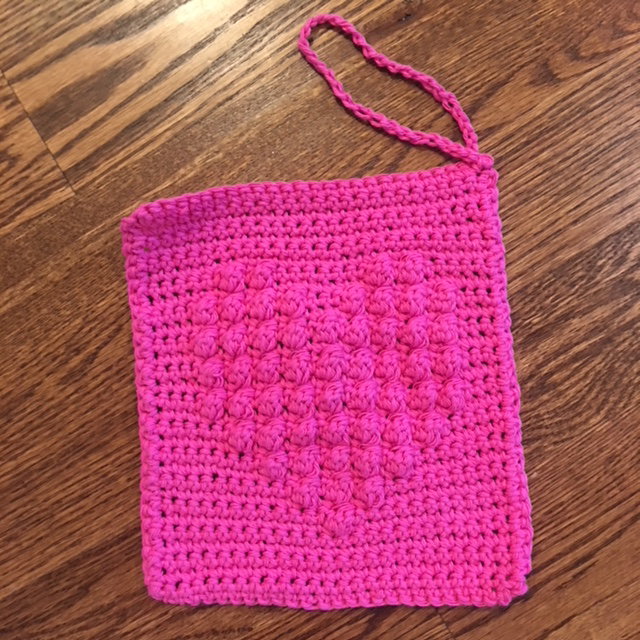
It’s an easy to follow pattern (thanks one crafty gal!) and the author encourages playing around and getting inspired by it. I definitely will. It combines my passions of crochet and pixel art. I’ll be making non-heart shapes like Pac-Man and Pac-Man ghosts soon.
If you know me, you won’t be surprised about my plan to write functions to create these patterns and plot them in ggplot2. It’s on my to-do list for a future blog post.
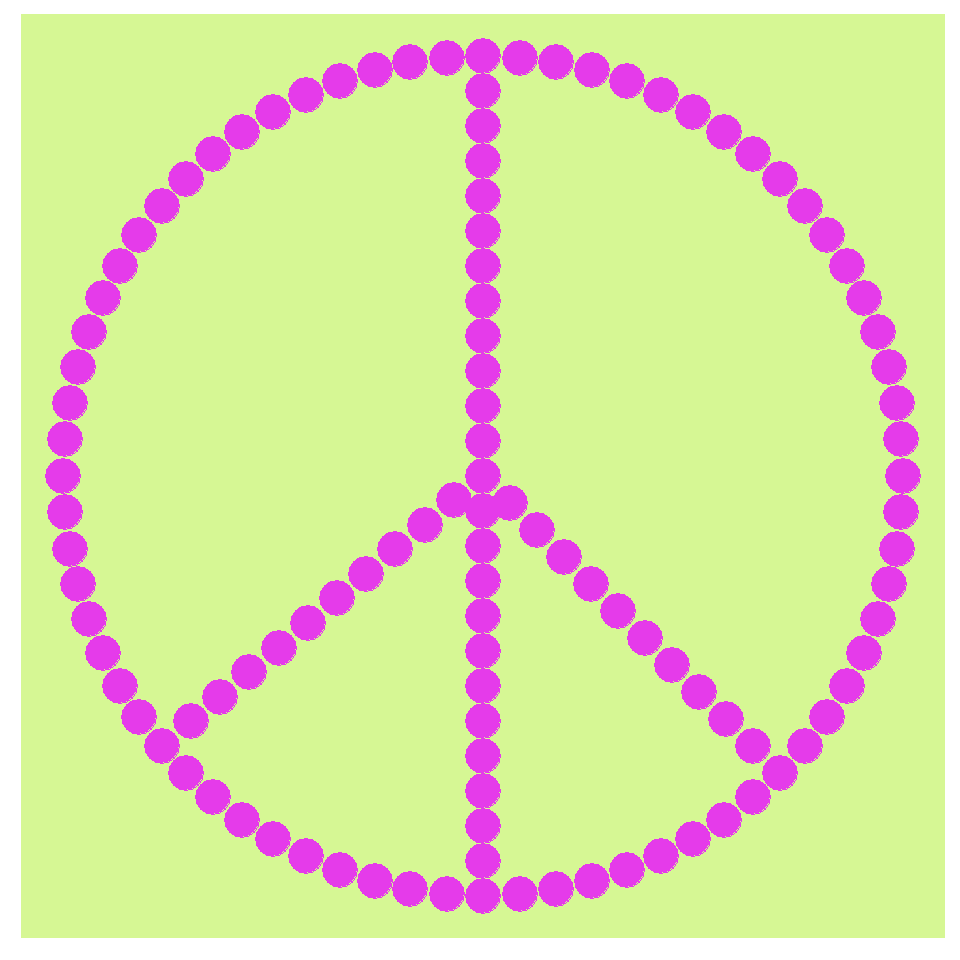
Peace
As promised, just a tiny bit of fun with R to add some peace to your life.
# add ggplot2, obviously
library(ggplot2)
# create a theme
peace_theme <- theme(panel.grid = element_blank(),
                       panel.background = element_rect(fill = "#d6f794"),
                       axis.text = element_blank(),
                       axis.ticks = element_blank(),
                       axis.title = element_blank(),
                       legend.position = "none")
# function to make a circle
circle_points = function(center = c(0, 0), radius = 1, npoints = 360) {
  angles = seq(0, 2 * pi, length.out = npoints)
  return(data.frame(x = center[1] + radius * cos(angles),
                    y = center[2] + radius * sin(angles)))
}
# make the circle
peace1 <- circle_points(radius = 12, npoints = 73)
# make the diameter
peace2 <- data.frame(x = rep(0,25), y = seq(-12, 12, 1))
# make the first radius
peace3 <- data.frame(x = seq(0, peace1[45,1], length.out = 12),
                     y = seq(0, peace1[45,2], length.out = 12))
# make the second radius
peace4 <- data.frame(x = seq(0, peace1[64,1], length.out = 12),
                     y = seq(0, peace1[64,2], length.out = 12))
# bind them all together
peace <- rbind(peace1, peace2, peace3, peace4)
# plot
ggplot() + geom_point(data = peace,
                      aes(x = x, y = y),
                      color = "#e53bea",
                      size = 6)   +
                      peace_theme